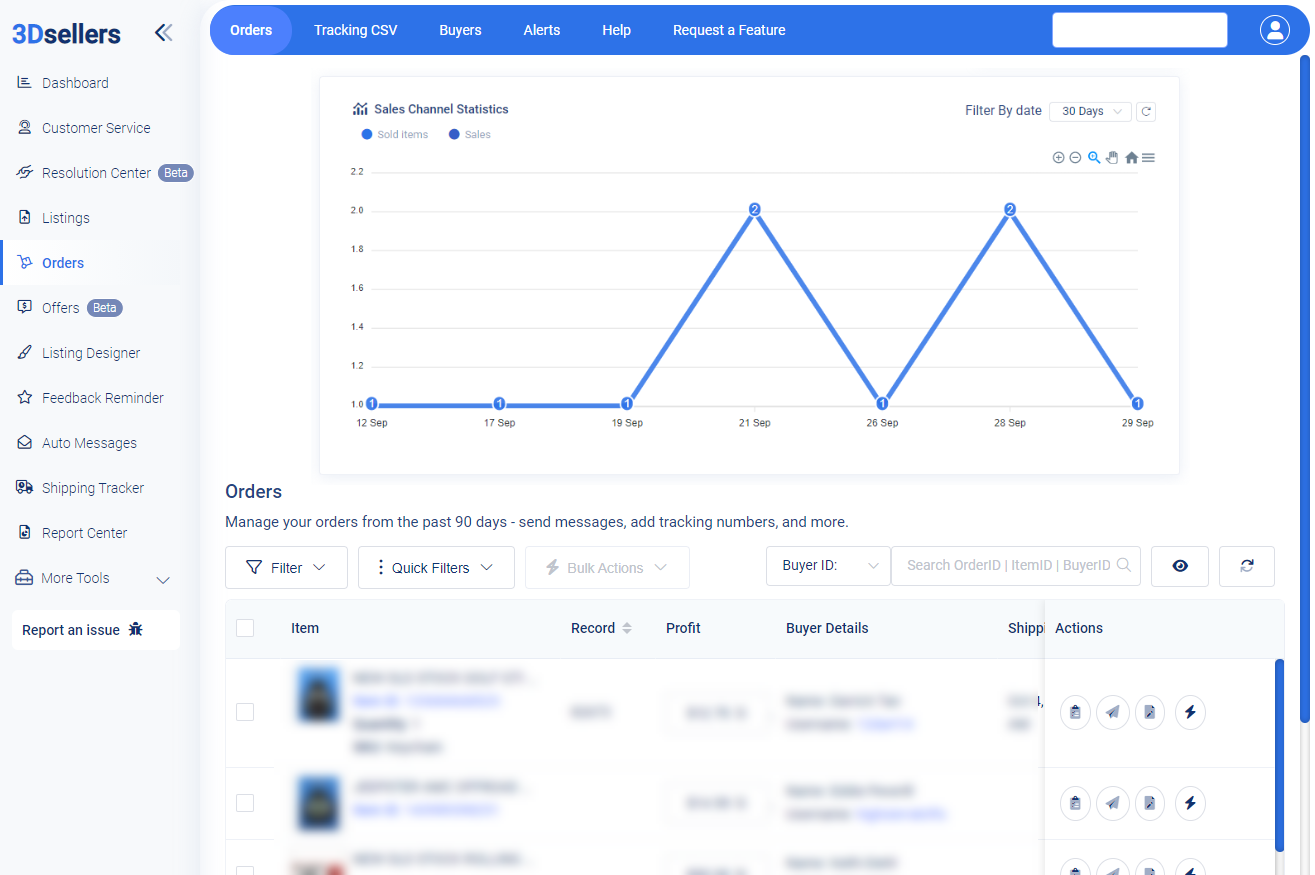
Use orders filters to make a daily chart for the number of:
- Total Orders
- Total Items Sold
- Sales Volume
- Returns
- Total Return Amount
Perhaps date filters would control the timeframe.
Then, we can apply other filters to see charted data for certain accounts, shipping services, buyers, etc